Fish Light
Color Mixing
In this section, I would like to briefly discuss how the three narrow-band color channels (R, G, B) are used to mimic the continuous color spectrum of the sky throughout the day.
Some physics behind it
There exist different ways of expressing colors. The most fundamental physical quantity related to colors is the frequency of light. It is often transformed to wavelength, which is the speed of light divided by the frequency λ = c/f. However, since most of us - humans - can only see the world through three colors: red, green and blue (also known as the `primary’ colors), any color that belongs to the visible spectrum (approximately 400 - 700 nm wavelength) can be “synthesised” by mixing of the primary colors in the right proportions. For example, our eyes will not be able to distinguish between the originally yellow color from the proper mixture of red and green.
Color can also be expressed in terms of temperature (K), although this definition is more subtle. Simply speaking, when a physical body is heated, it begins to radiate the energy. The spectrum of this energy is continuous, but it does possess a peak at a certain frequency. Now, the higher the temperature of the body, the further this peak is being shifted towards higher frequencies (from red to blue). The color resulting from the particular spectrum became directly related to the temperature of the body, hence the concept color temperature. It is important to add here, that the body is not just any object, but it is specifically related to a so-called “black body”, which is a purely theoretical concept. Still, certain objects behave very much like black bodies including our Sun, which a good example.
Temperature to RGB transformation
The challenge is to represent the continuous spectrum of the sky. The color of the sky originates from the sunlight and it is the effect of light being scattered by the atmosphere. It is still continuous in spectrum, but we need to have it represented by the three primary colors. There exist mathematical models, however for this application it is fine to use tabulated data.
Brightness correction
Although the data presented in provide the necessary link between the two representations, they do not take into the account that we use LEDs as light source. In fact, for LEDs the light intensity of each channel is rarely equal. The first source of this imbalance is the fact that RGB LEDs are usually formed by combining three individual single-colored LEDs in one package. Since each of them has a different light conversion efficiency, they emit different optical power for the same electrical power. Furthermore, even if their optical powers were equal, our eyes are not equally sensitive to all colors.
Our perceptual response to light power(not relative to colors) is expressed in terms of luminescence. According to the datasheet provided by the RGB LED manufacturer, the maximum luminescence of the individual colors are 67.5 cd, 165 cd, 60 cd, for red, green and blue respectively. Hence, if all three channels are provided with the same electric current, the green color appears as the brightest. Therefore, in order to reconstruct the color of the sky, it is necessary to equalise channels in terms of luminescence. There are two ways to do it. It can either be done in hardware by applying an additional series resistance to each channel or it is possible to apply a correction factor in the software. I found it both easier and more efficient to correct for the color in software.
Solving the brightness problem
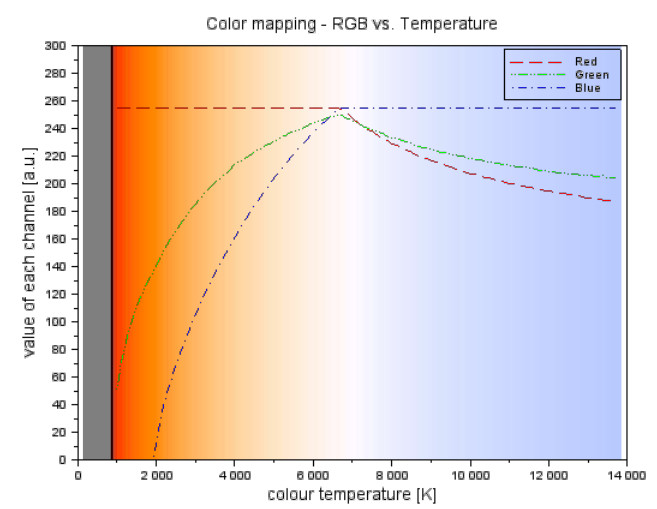
Figure 1. shows the relationship between the RGB channels and the color temperature (assuming equal brightness). Note that since range is limited to an 8-bit value, there exists point when the brightness of one channel cannot be increased any more and the others have to drop in order to preserve the mutual proportions. This point corresponds to the instance, when light at some point will stop appearing orange and begin to seem more bluish. It will cross the point, where all three channels are nearly maximum, corresponding to light being almost purely white. According to the figure, this occurs at around 6700 K. In order to calibrate the channels, I tuned the channels to obtain this shade by reducing the duty cycle of green and blue channels, at the same time reading the value displayed in binary using the STK600.
Although this method of calibration does not produce absolutely accurate results, it is certainly sufficient for the application. What is more, in order to reduce the effects of the brain memory and perception, I tried to cross this point several times both ascending and descending the temperature, each time noting the binary value down. The new channel values served as a reference point:
Then, each of the channels’ values was decreased linearly by accounting for this difference.
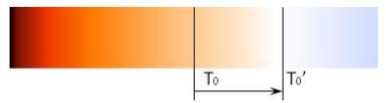
Next step was to “skew” the color range. When looking at the figure 1. the color shades are nearly equally distributed both left to and right from the 6700 K point. In fact, however, the more “interesting” time from the aesthetic point of view occurs during the sunrise and sunset. It is also when the colors are changing the fastest rate. During the rest of the day (or night) the blue color is nearly a constant. Therefore, it seems useful from both aesthetic and practical point of view to shift the range such that the red part of the range could get more resolution, while sacrificing the resolution of the blue part. For this reason, we transform the domain (temperature) in order to apply the change. For this purpose, we use the so-called γ-correction. Although it is normally used to adjust the brightness, here we will use it for color.
Finally, when below 1000K the olour of the table is not defined. Therefore, I decieded to use this as an opportunity ti add few more color shades that could represent the sky shortly after sunset or before the sunrise. For this reason, I added a weak blue component to obtain a purple-like shade, while the sky at night is defined as a very weak blue [0,0,1].
Fitting the day cycle
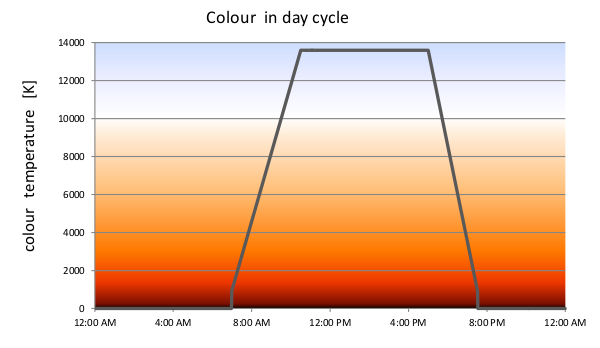
The exact color of the sky during the day depends on many factors. It is only possible to estimate the color temperature based on one’s perception. Here, I have chosen a very simple solution. The assumed sunrise is set to start at 7 a.m. and it is followed by 3.5 hour sunrise period. During this period, the imitated color temperature is increased linearly with time, reaching the maximum of 13600K at 11:30 a.m. For the next 6.5 hour the light is constantly lit at the maximum temperature value. At exactly 5 p.m. the reverse process occurs and the light is constantly decreasing the temperature reaching full darkness 3 at 8:30 p.m.
Since the color table was shifted, the change in shade of the blue color is practically not to be notices. The changes in red color shades are more visible. However, since the color is updated every minute or so, and the colors are similar, the changes are disturbing to human eye (nor apparently the fish).